
5.7. Understanding vPlanner Metrics
Workplan Metrics
As teams create and finalize production plans, vPlanner tracks advanced production planning metrics in the background so that teams can use those metrics to steer production towards targets. You can review the metrics from the Reports menu.
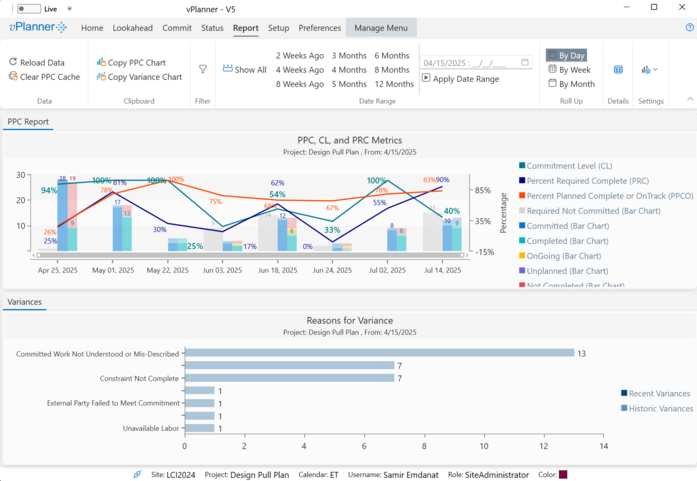
Figure 53 – Production Planning Metrics under the Report Menu
Percent Planned Complete (PPC) - Red Line
The PPC metrics tracks the percent of the completed or OnTrack commitments from the total commitments. It does not distinguish between required and backlog tasks. PPC is represented by the red line on the chart. The goal for the PPC metric should be 100% and it should be noted that it is very difficult to achieve 100% each workplan.
PPC = Completed + On Track / Committed (Goal 100%)
|
Commitment Level (CL) - Teal Line
The CL metric measures if the team is starting enough work when the workplan is created to keep the milestones on track. CL is what links near term planning to long term goals.
To understand CL one needs to understand how vPlanner treats Required work and Backlog work.
Generally speaking, Required Work is work that is driven by some milestone target. In other words, it is work that has a Late Start (LS) and a Late Finish (LF) date which can only come from the backward pass calculation and those are the pull dates. They are what determines the priority of a task in the system relative to its target.
Not all Required work is priority work. Look for Required CAN and Required SHOULD to identify priority work.
|
When vPlanner looks at Required Work in relation to workplan's due date, it falls in three categories:
Required CAN: is the required work that can start or finish within the workplan due date (i.e. its forecast dates FS & FF are within the workplan due date).
Required SHOULD: is the required work that must finish before the workplan due date (i.e. its LF date) is within the workplan due date.
Required WILL: is the part of Required CAN that is committed.
Commitment Level then is the percentage of Required WILL to Required SHOULD. It show how much of the priority work the team is willing to start or finish by the workplan due date. The goal for CL should be 100%. If the plan has late paths, it would be impossible for a team to commit to everything from the Required SHOULD as its LF dates will mathematically fall outside of the workplan due date. This is the effect of the Last Planner System shielding rule which states that works should not be required to start things that cannot start.
LPS Shielding Rule: vPlanner applies the LPS Shielding rule automatically and will not allow work that cannot start to be on a Workplan as a Commitment.
|
If CL is less than 100% when the workplan is created, a team manager should set up recovery planning meetings during the week to recover the lost time as it will continue to drop the following week unless the team accelerates or replans the remaining work during the week.
CL = Required WILL / Required SHOULD (Goal is 100%)
|
Percent Required Complete (PRC) - Blue Line
This metric measures the percent of the required tasks completed at the time the workplan is finalized. It does not matter if those completed tasks started as Committed tasks or not. If the PRC metric is less than 100% at the end of the week, then the team must re-plan as they already have late paths in the plan that will only get worse if another planning cycle goes by.
PRC = Required DID / Required SHOULD (goal is 100%)
|
Reasons for Variance
The reasons for variance will show the categories of why tasks failed to be completed and charts the result. If you click the Details button under the Report menu, you can see the full details of the variances and their root causes.
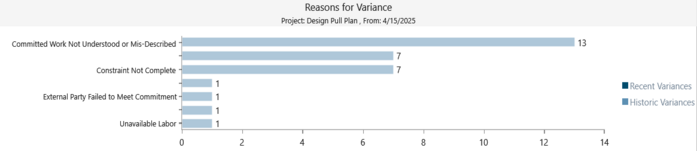
Figure 54 – Reasons for Variance
Variance Details
Click the Variance Details button to bring up the Variance Details window where you can review the detailed list of variances, filter the list, or export it to Excel.

Figure 55 – Variance Details
You can also use the Isolate in Manage View button to find the tasks are selected in the variance details and isolate them in the Manage View for a detailed impact analysis by tracing their successors for example.
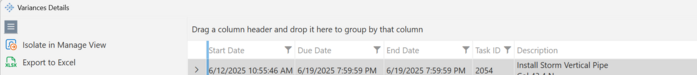
Figure 56 – Variance Details Window
vPlanner, LPS, and Metrics in Depth
For an in depth look at the evolution of Last Planner System® and the improved production planning metrics and their use to steer production towards targets, please take some time to view this recorded webinar offered in collaboration with the Lean Construction Institute.
Steering Production Towards Targets Webinar